How has use of framing protection security headers changed in the past 3 years?
Back in 2023, I wrote a diary[1] discussing how commonly X-Frame-Options and CSP headers containing the frame-ancestors directive were used on 1 million most popular domains on the internet (based on the Tranco list[2]), and how they were set. Given that three years have passed since then, I thought it might be interesting to repeat the analysis and see what – if anything – has changed in the meantime.
Before we get to the data, however, let’s briefly recap what the headers in question do and why they are important.
Both headers basically serve the same fundamental purpose – they inform a browser whether the content of a given web page may be embedded in an iframe or similar object on another web page. Without either of these headers in place, any web page may freely load any other web page in an iframe, which can be quite beneficial in some instances, but also provides a functionality that is commonly abused by phishing actors[3].
The most common abuse scenario is related to a generic framing attack, and leads to what is sometimes called an “overlay phishing”. It is based on an attacker creating a malicious page which loads a legitimate website (usually the official company website of the recipient of the phishing) in a full-screen iframe, then overlays a fake login prompt on top of it. The result is that the victim sees what may appear to be the real login page. Setting either X-Frame-Options or CSP with the frame-ancestors directive on the legitimate site effectively mitigates this approach, because the browser will refuse to load the page inside an iframe in the first place, and all that would be displayed would be a fake login form over a browser message informing the user that a page cannot be loaded (which should make the credential stealing form apper less than trustworthy to most people).
This is a good reason why these headers are worth implementing on any organization's web site, regardless of how prominent or otherwise “interesting” the organization might consider itself to be.
For completeness’ sake, it should be mentioned that although the two security headers serve a similar purpose, they are not exactly equal. The X-Frame-Options header is the older of the two mechanisms and, while functional, is relatively limited in what it can express. It supports three directives: DENY (the page may not be framed by anyone), SAMEORIGIN (the page may only be framed by pages on the same origin/domain), and ALLOW-FROM (the page may be framed by a specific origin/domain).
Although the header in general is still widely supported and does its job well, its ALLOW-FROM directive was never universally supported by all browsers and is now considered obsolete[4]. More importantly, however, the X-Frame-Options header as a whole has been basically superseded by the Content Security Policy frame-ancestors directive.
The CSP frame-ancestors directive offers considerably more flexibility than X-Frame-Options. It supports the same basic use cases (frame-ancestors 'none' being equivalent to DENY, frame-ancestors 'self' being equivalent to SAMEORIGIN), but also enables some additional ones (such as supporting wildcard matching for subdomains etc.). Modern browsers therefore generally treat frame-ancestors as the authoritative directive, ignoring X-Frame-Options entirely when both are present[5]. That said, X-Frame-Options remains relevant for legacy browser compatibility and – in practice – both headers can be sent simultaneously without any harm, which is what many HTTP servers actually do.
With this context in mind, let us look at how the use of these headers has evolved since 2023.
The data was gathered using the same approach that I used in 2023 – I used a simple Python script that went through the current Tranco list of the 1 million most popular domains and attempted to connect to each one over HTTPS, recording which security-related headers were present in the response. The script performed no retries on failure, and the following numbers are therefore not completely precise. Nevertheless, based on a few tests, I would estimate the error rate to be significantly less than 0.5%, which I consider sufficient for our purposes of seeing whether and how the use of both “framing protection” headers has changed over time.
And as you may see from the following charts, which include both the 2023 and 2026 data for comparison, the numbers have indeed moved in an interesting way over the past three years (and the direction of movement is not entirely consistent across different sample sizes).
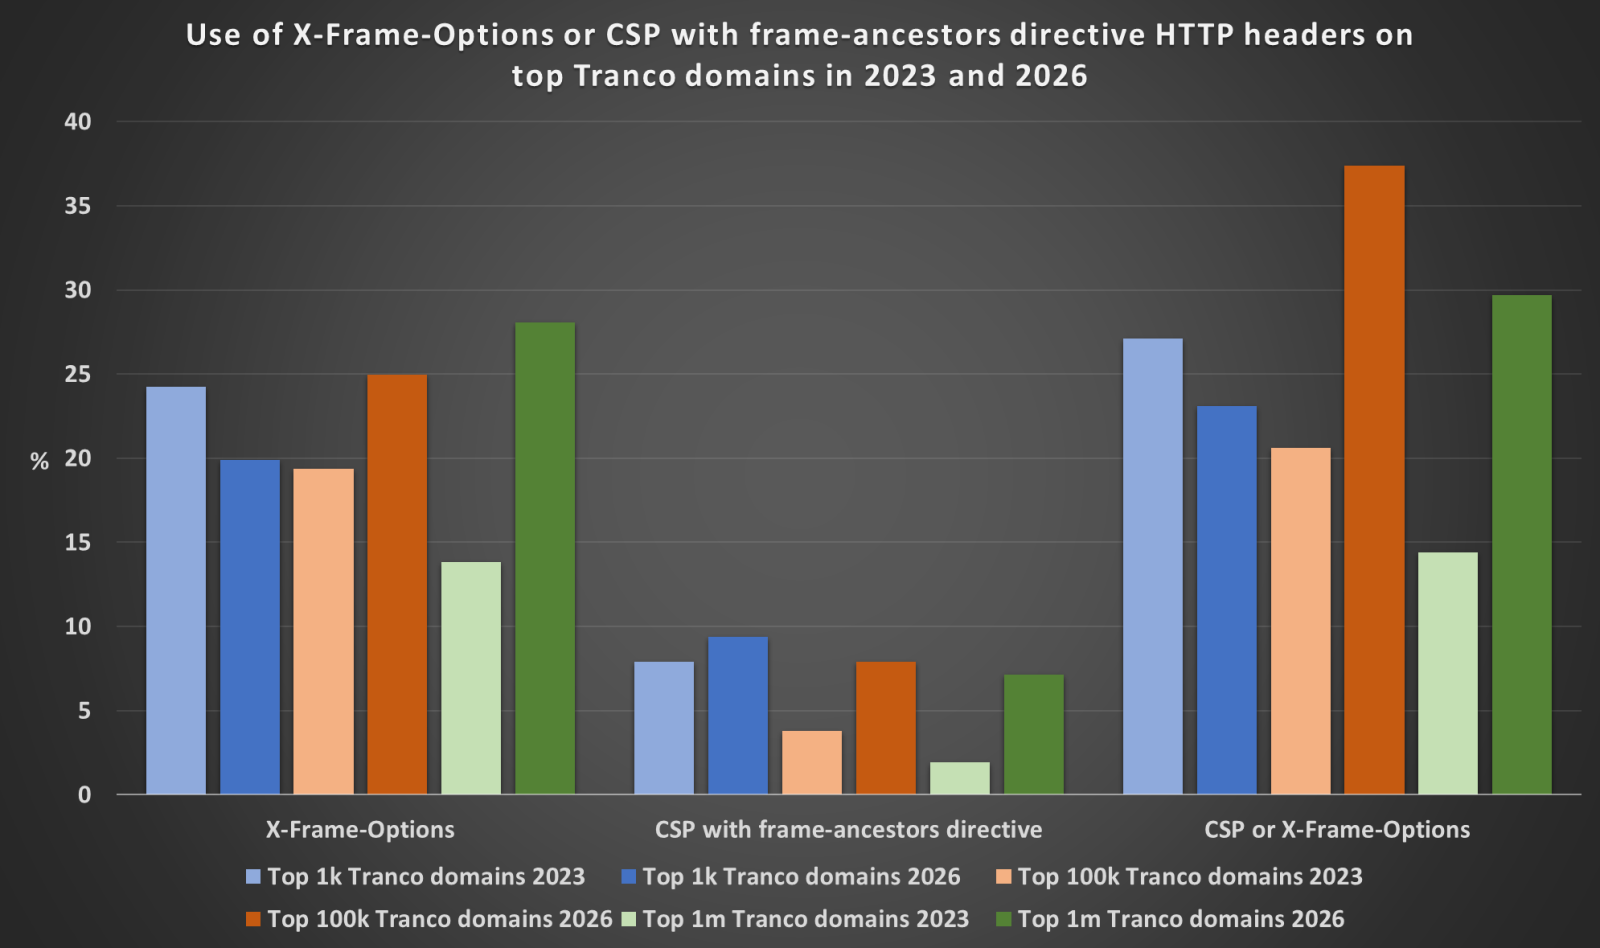
In the top 1 thousand most popular domains, the overall coverage by either X-Frame-Options or CSP frame-ancestors directive has actually decreased – from 27.1% in 2023 to 23.1% in 2026. On the other hand, in the top 100 thousand domains, the coverage has increased significantly – from 20.6% to 37.4% – and in the full top 1 million domains it has grown from 14.4% to 29.7%. The divergence between the top 1k and the larger samples is somewhat puzzling at first glance, though it likely reflects the fact that the composition of the top 1k list has changed quite a bit over three years, with domains of some security-conscious organizations dropping out of the top 1k and being replaced by domains that don't serve web content in the traditional sense (CDN endpoints, infrastructure domains, API backends, and so on) and therefore don't send security headers at all.
Looking at the breakdown of specific X-Frame-Options directives in use, SAMEORIGIN remains the most common choice across all sample sizes, which is not surprising, as it is generally the most practical option for most web applications.
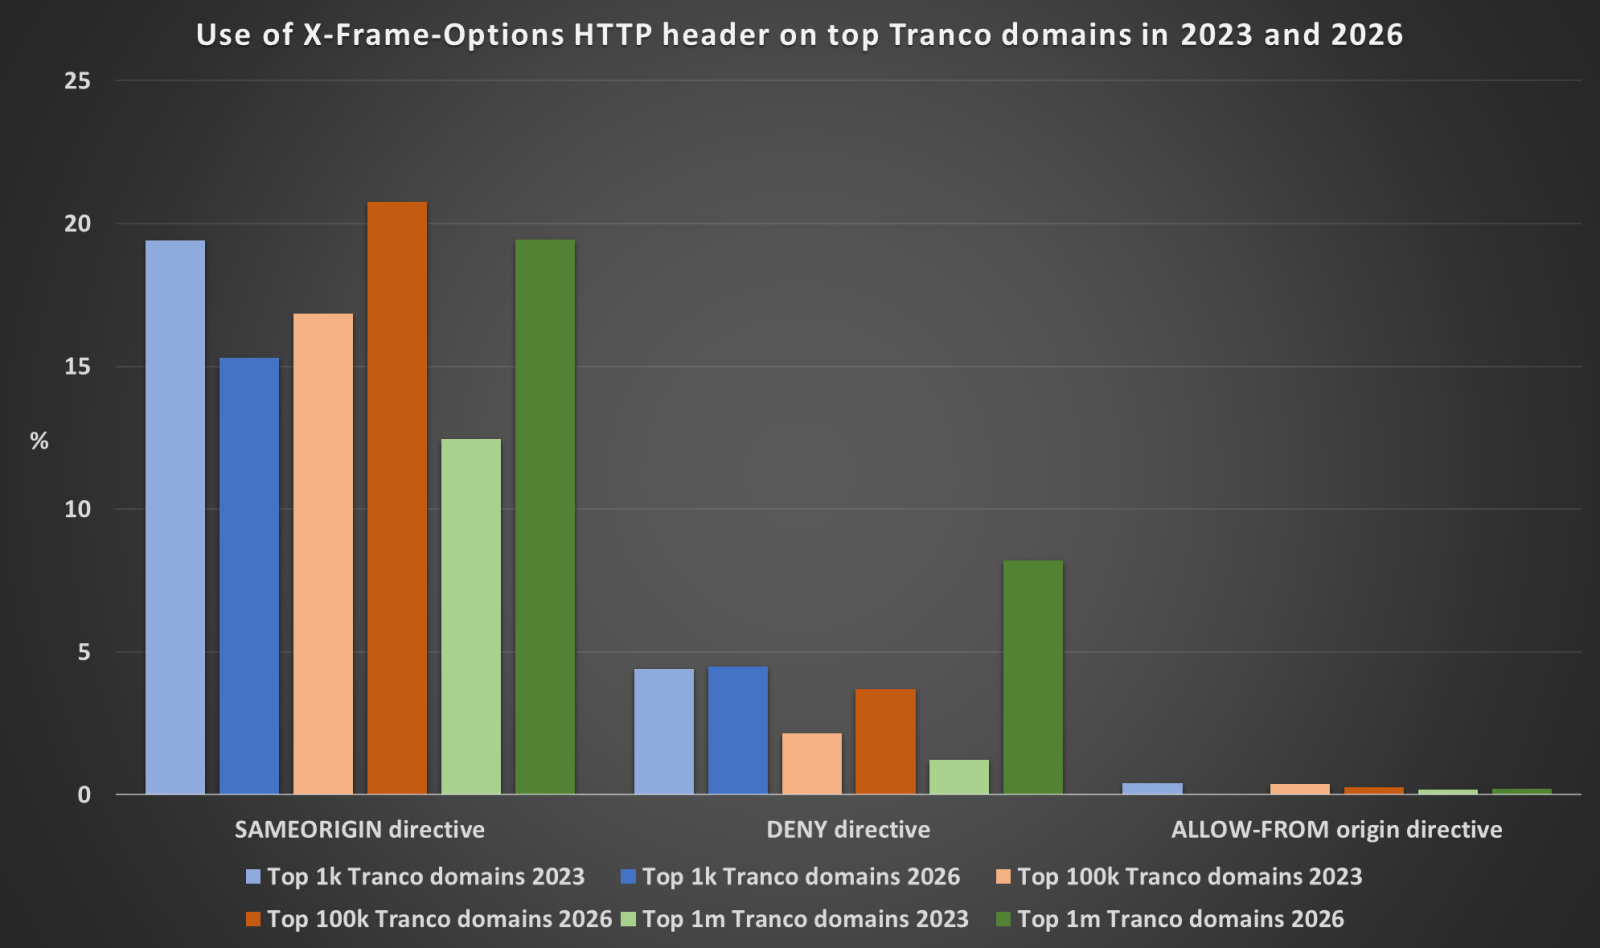
In the top 1 thousand domains, SAMEORIGIN has actually declined (from 19.4% to 15.3%), while in the top 100 thousand and top 1 million, it has increased notably – from 16.9% to 20.8% and from 12.4% to 19.4% respectively. The DENY directive has seen modest increases across all sample sizes, and the ALLOW-FROM directive remains at negligible levels in the larger samples and is completely absent from the 1k sample.
When it comes to CSP with the frame-ancestors directive, the numbers tell an encouraging story across all sample sizes. In the top 1k, usage has grown from 7.9% to 9.4%. In the top 100k, it has more than doubled – from 3.8% to 7.9%. And in the full 1 million sample, the increase is even more dramatic, from 1.9% to 7.1%.
This, next to the aforementioned more than doubling of domains that use either CSP frame-ancestors or X-Frame-Options, is one of the two the most positive findings in the entire dataset. As discussed above, CSP frame-ancestors is the currently recommended approach for preventing framing attacks, so its growth relative to X-Frame-Options, as well as in absolute terms, is a welcome trend.
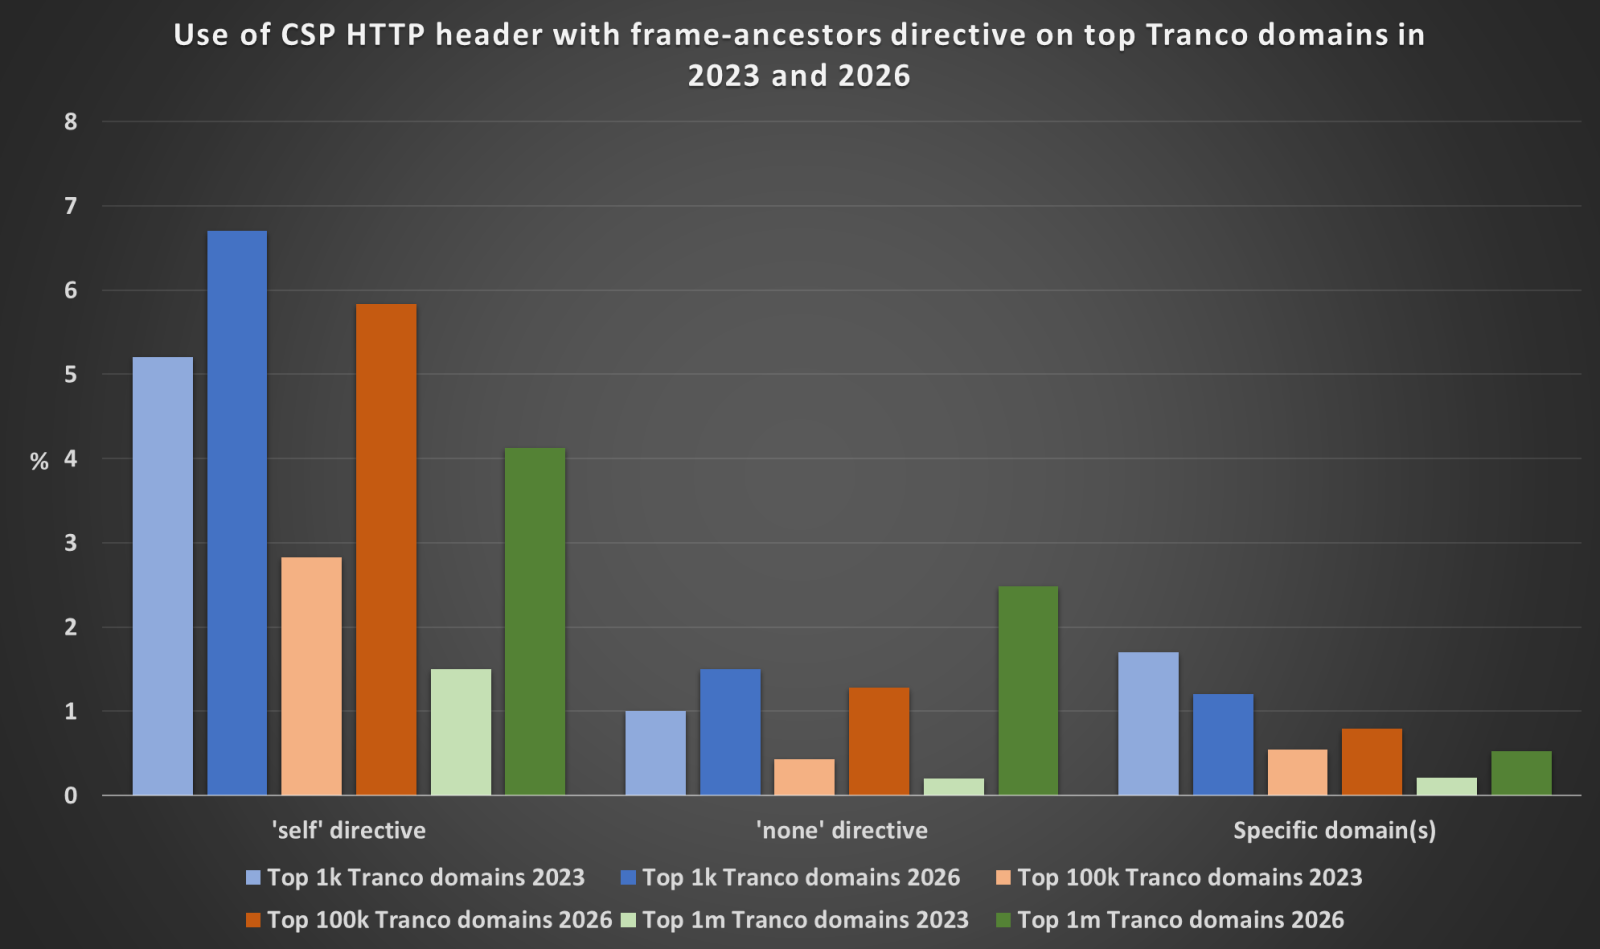
Looking at the specific values used in the frame-ancestors directive, 'self' remains the most common choice, which is consistent with the 2023 findings. The 'none' directive, which provides the strictest protection by disallowing framing entirely regardless of origin, has seen notable growth in the larger sample sizes – from 0.43% to 1.29% in the top 100k, and from 0.20% to 2.49% in the top 1 million. This suggests that at least some administrators are becoming more deliberate in their framing policies, choosing to explicitly disallow all framing rather than merely restricting it to the same origin. The use of specific domain(s) in the frame-ancestors value has remained relatively flat or slightly decreased across all sample sizes, which is expected, as this configuration requires more deliberate setup, and is generally only applicable to specific deployment scenarios (e.g. embedded widgets, single sign-on flows etc.).
To sum up, despite the slight regression in the top 1k, the overall picture that emerges from the 2026 data is noticeably more positive than the 2023 one. Both X-Frame-Options and CSP frame-ancestors are more widely deployed across the 1 million most popular domains – and one can therefore assume that across the internet as a whole as well – than they were three years ago. CSP frame-ancestors in particular has seen a very significant growth, which is encouraging.
On the other hand, even with these improvements, the data still shows that even the majority of the most popular domains on the internet do not use either of these headers at all, leaving their users potentially exposed to framing-based attacks, including the phishing techniques discussed at the beginning of this diary. Given how straightforward these headers are to implement (for most web applications, adding the appropriate response header is a matter of a single line of server configuration), there is clearly still considerable room for improvement across the industry as a whole.
Then again, this also means that it will be that much more interesting to see where things stand in another two or three years…
[1] https://isc.sans.edu/diary/29698
[2] https://tranco-list.eu/
[3] https://isc.sans.edu/diary/29638
[4] https://developer.mozilla.org/en-US/docs/Web/HTTP/Reference/Headers/X-Frame-Options#allow-from_origin
[5] https://w3c.github.io/webappsec-csp/#frame-ancestors-and-frame-options
-----------
Jan Kopriva
LinkedIn
Nettles Consulting


Comments